
Creating Free Dashboards with Looker Studio

Many marketing team members struggle to update reports and prepare for meetings with their busy schedules. But, if they store their marketing data on Google properties, connecting them to Looker Studio and creating dashboards that keep everyone updated is easy and free.
What is Looker Studio?
Looker Studio (formerly Google Data Studio) is a free business intelligence and data visualization tool from Google that allows users to create interactive and customizable reports and dashboards. It enables businesses to connect multiple data sources (such as Google Ads, Google Analytics, BigQuery, and third-party platforms) to visualize data in a meaningful way.
Creating Report
Let's assume we have Google Analytics 4, Google Search Console, and Google Ads and want to create a dashboard to show our results during our monthly marketing meeting.
We need to go to this link to start the process. These images show your canvas:

You can also see some templates, which is a good place to explore whether they cover your needs.
There are some general rules that we will review here. Whether you start from scratch or choose one report from the template lists, you must connect one data source.
Let's start with a blank report:
When you click on Create a report, you will see this box:

Choose the country and enter the company name. After reviewing Google's terms and conditions, check the box and click ‘continue.’
If you want to receive updates, say yes to any updates you are interested in.

You are now ready to start your first report. Click on ‘create a report’:

At this step, you need to connect your data source. You may also search for your source if you cannot see it on the first page.

For this learning process, we choose Google Analytics:

Click "Authorize" and log in with your connected Google account and ensure that you choose the right property:

Click add to the report:

Google automatically will add a table to the page, and you can start creating reports.


Now, let's get familiar with some elements on this page.
We can choose the metrics we want to include from the metric section in the report.

This section allows us to compare our reports. The comparison could be complex or as simple as this period compared to the last period.

This section allows us to compare our reports. The comparison could be complex or as simple as this period compared to the last period.

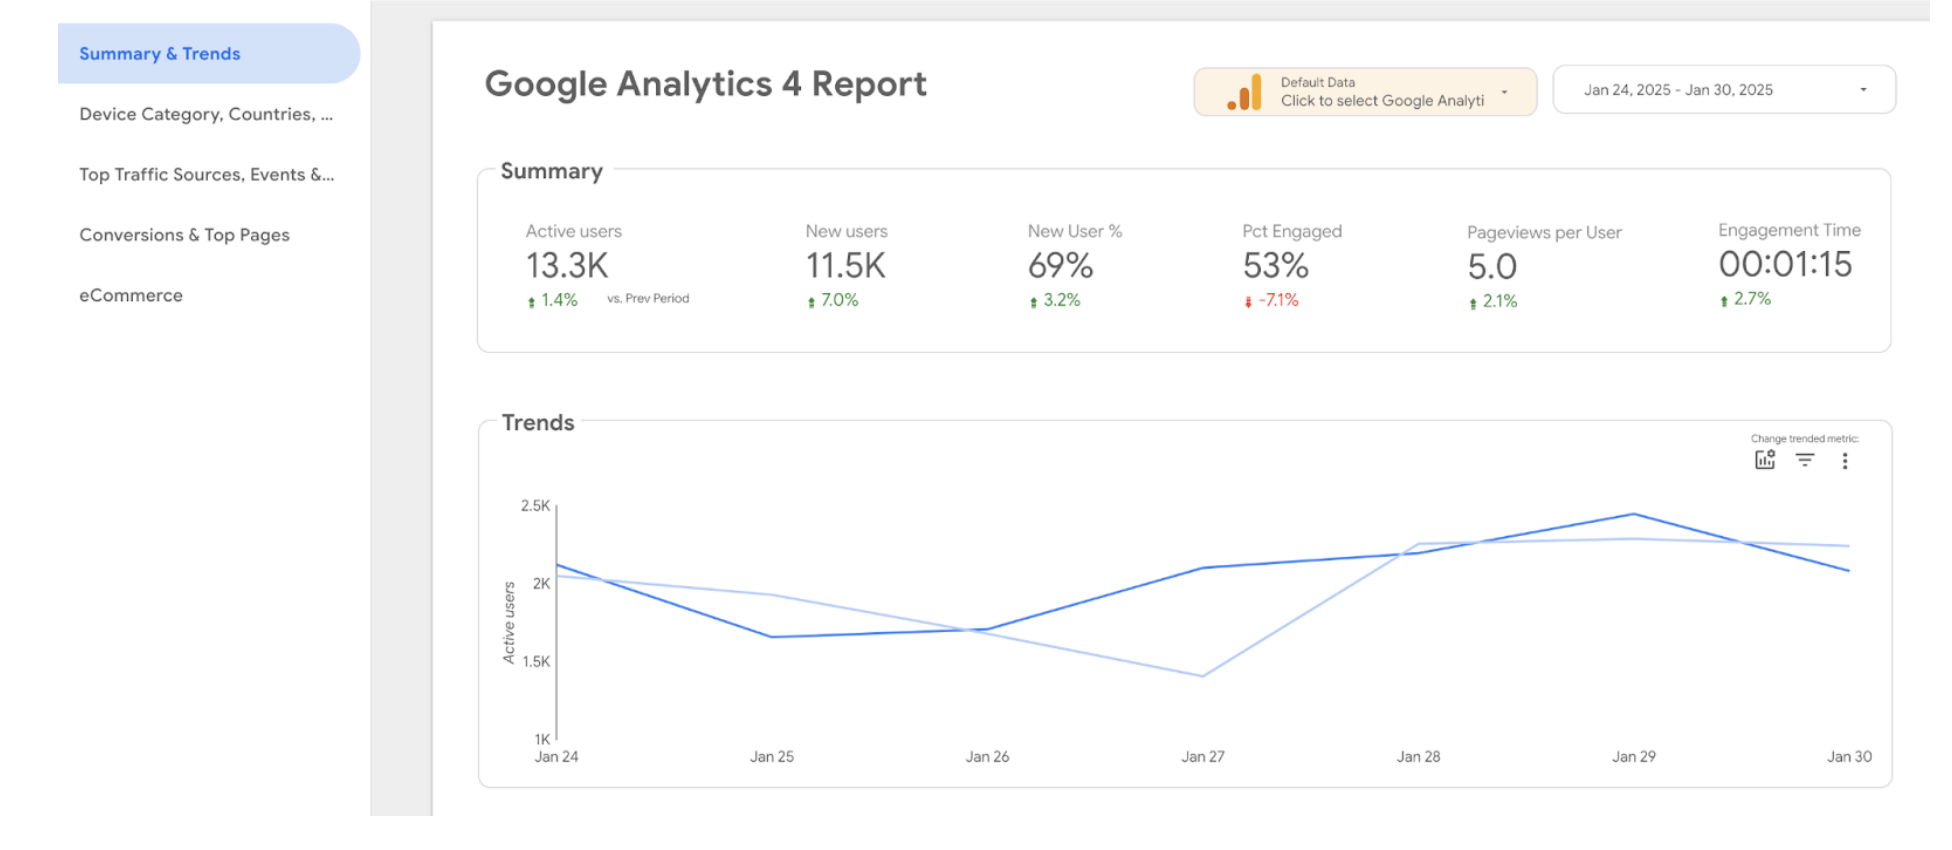
After adding valuable elements to the report, it might look something like this:
There is a lot that we can review in this reporting system. We will create reports for different industries in the following parts.